|
|
 |
|
There are numerous ways to sample plant communities. You may have heard of "sample plots" or "transect sampling".
The plant community sampling technique used in the WHEP is a method adapted from the Minnesota Department of Natural
Resources County Biological Survey and Natural Heritage program. This sampling method is a European method called the releve
sample.
Essentially, this is one large plot which is used to characterize the most representative plant community.
In the case of WHEP, the releve plot is a standard 100 square meter plot that is located in the emergent zone of the
plant community. The emergent zone is typically located in the near shore area of the wetland.
|
|
|
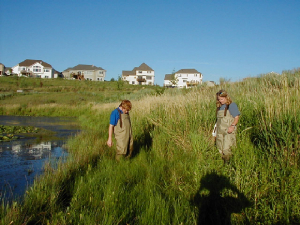
| Volunteers choose a plot to sample |
- Enter info about only sample in July. Use info from Mark's field method
presentation?
-
- Should we redo this and use smaller individual pages for each of these with more photos?
Patty has already put together a plot location page. Click here- Sample Plot Placements
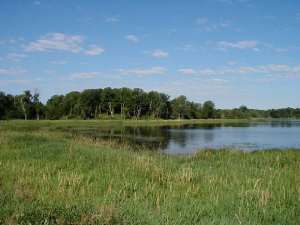
- Determine the plant communities in the wetland.Ideally, find a place to view the entire wetland.
From this point, note the major vegetation types in the wetland. Don't focus on specific plant species. Instead, look
at the general plant community pattern. For example, note any differences in the vegetation from one area of the wetland
to another. Are there patches of shrubs surrounded by grasses and sedges? Or perhaps the only vegetation you see
is around the wetland edge and the center of the wetland is open water. Do you see any floating or emergent bed plants?
- Locate a spot for a representative plot. After you have identified the major vegetative
patterns, determine where you could place ONE 100 m2 plot that would best capture or represent the vegetation types found
in that wetland. Since emergent plants like cattails and grasses readily respond to human influences, locate your sample
plot in the emergent vegetation, or, if there is not an emergent community present, locate the plot where one should be. Show
the location of your releve plot on your site sketch sheet.
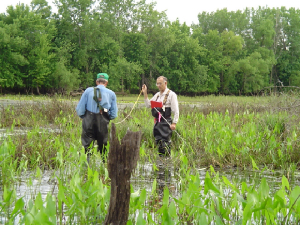
- Determine the shape of the plot. Now that you have found a location for your plot, determine
which plot shape (both equal to 100 square meters) would best capture the emergent plant community in that wetland:
5 meters x 20 meters or 10 meters x 10 meters
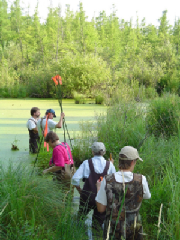
- Lay out the 100 square meter plot. Choose a point to be corner #1 of your plot.
Flag or stake this corner. Using a compass (or your best visual judgement) measure or pace off the first side of the
plot, walking so that the inside of the plot is to your left and the outside of the plot is to your right. Flag or stake
this corner, corner #2. Now turn 90 degrees to your left and measure or pace the next side of the plot. Flag or
stake corner #3. Again, turn 90 degrees to your left and measure or pace the next side to corner #4. The four
flagged or staked corners should enclose an area equal to 100 square meters. If not make the necessary adjustments.
- Identify plants without trampling the plot. Next, inventory the plants within the plot to
genus, while trying not to trample the plot. It is ideal if one or two people walk the plot and a third person records their
observations.
To walk the plot:
- Begin at the first corner, walk just inside the plot toward corner #2, and identify the plants as you encounter them in
the plot.
- Record each plant in the appropriate category in the Field data sheet and add new plants as you encounter them.
Plants inside the border are counted in. PLants, rooted outside the border but with branches extending over the
sides of the plot are also included in the sample.
- Continue walking the plot, proceeding past corners 2, 3, and 4. After passing corner #4 proceed about 1/3 of the
way down the plot, cut through the plot to the opposite side. When you get to the opposite side, move down another 1/3 of
the side and cut through to return to corner #1.
- The plant inventory step should now be complete. Note any unidentified plants you encounter by coding them: unidentified
A, B, and so on. There is no need to collect any plants.
- Assign Cover Values For each identified plant genus found and any unidentified plants in
the plot, estimate cover values as shown below. Don't labor over estimating cover values. If half the team thinks the
cover class of sedge is 3 and the other half thinks it's 4, but both agree that sedge covers around 25%
of the plot, go with the lower value. To complete the Carex metric, note the actual estimated coverage of all
sedges in the plot.
|
|
Cover Class (CC) Estimate |
|
|
75-100% nearly completely covered |
|
|
50-75% large group, definitely >50% cover |
|
|
25-50% small group, near 50% cover.
|
|
|
5-25% plant common in plot, >5% cover.
|
|
|
1-5% plant is well established in plot, minimal coverage
|
|
|
0-1% plant is rare, insignificant cover.
|
| Volunteers walk the edge of the plot, |
|
| marking the four corners with flags. |
|
| Volunteers measure the edge of a plot. |
|
|
|
|
|
|
|
|
|
|
|
|
|
|
|
